
Logbook analytics
What this does
Opens the sixteen charts the app draws from your logbook — hours by type, approaches, runway use, punctuality and the rest — and says what each one counts.
That isn’t always what you’d guess from its name.
Before you start
- Your logbook filter doesn’t come with you. Filter down to one tail, open Analytics, and every chart is still drawing the whole logbook. A banner across the top says so for as long as a filter is on. The only narrowing on this screen is a year, on five of the charts.
- All sixteen are free. Analytics has no Pro check at all.
Steps
- On the logbook screen, tap Analytics in the toolbar. It fills the whole
window, and it always opens on Monthly Activity — not necessarily the
chart you came for.
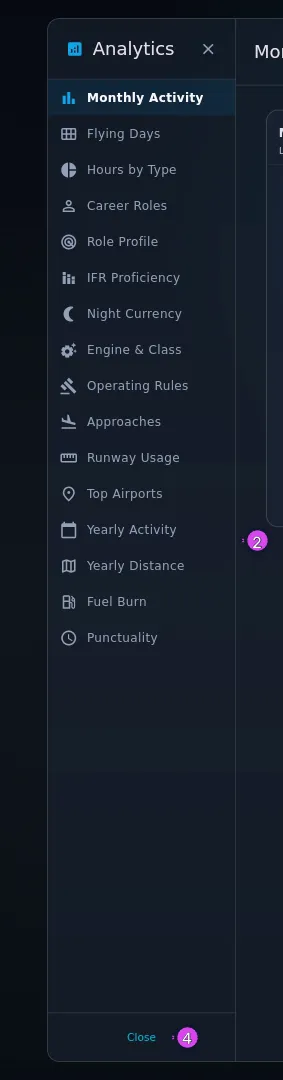
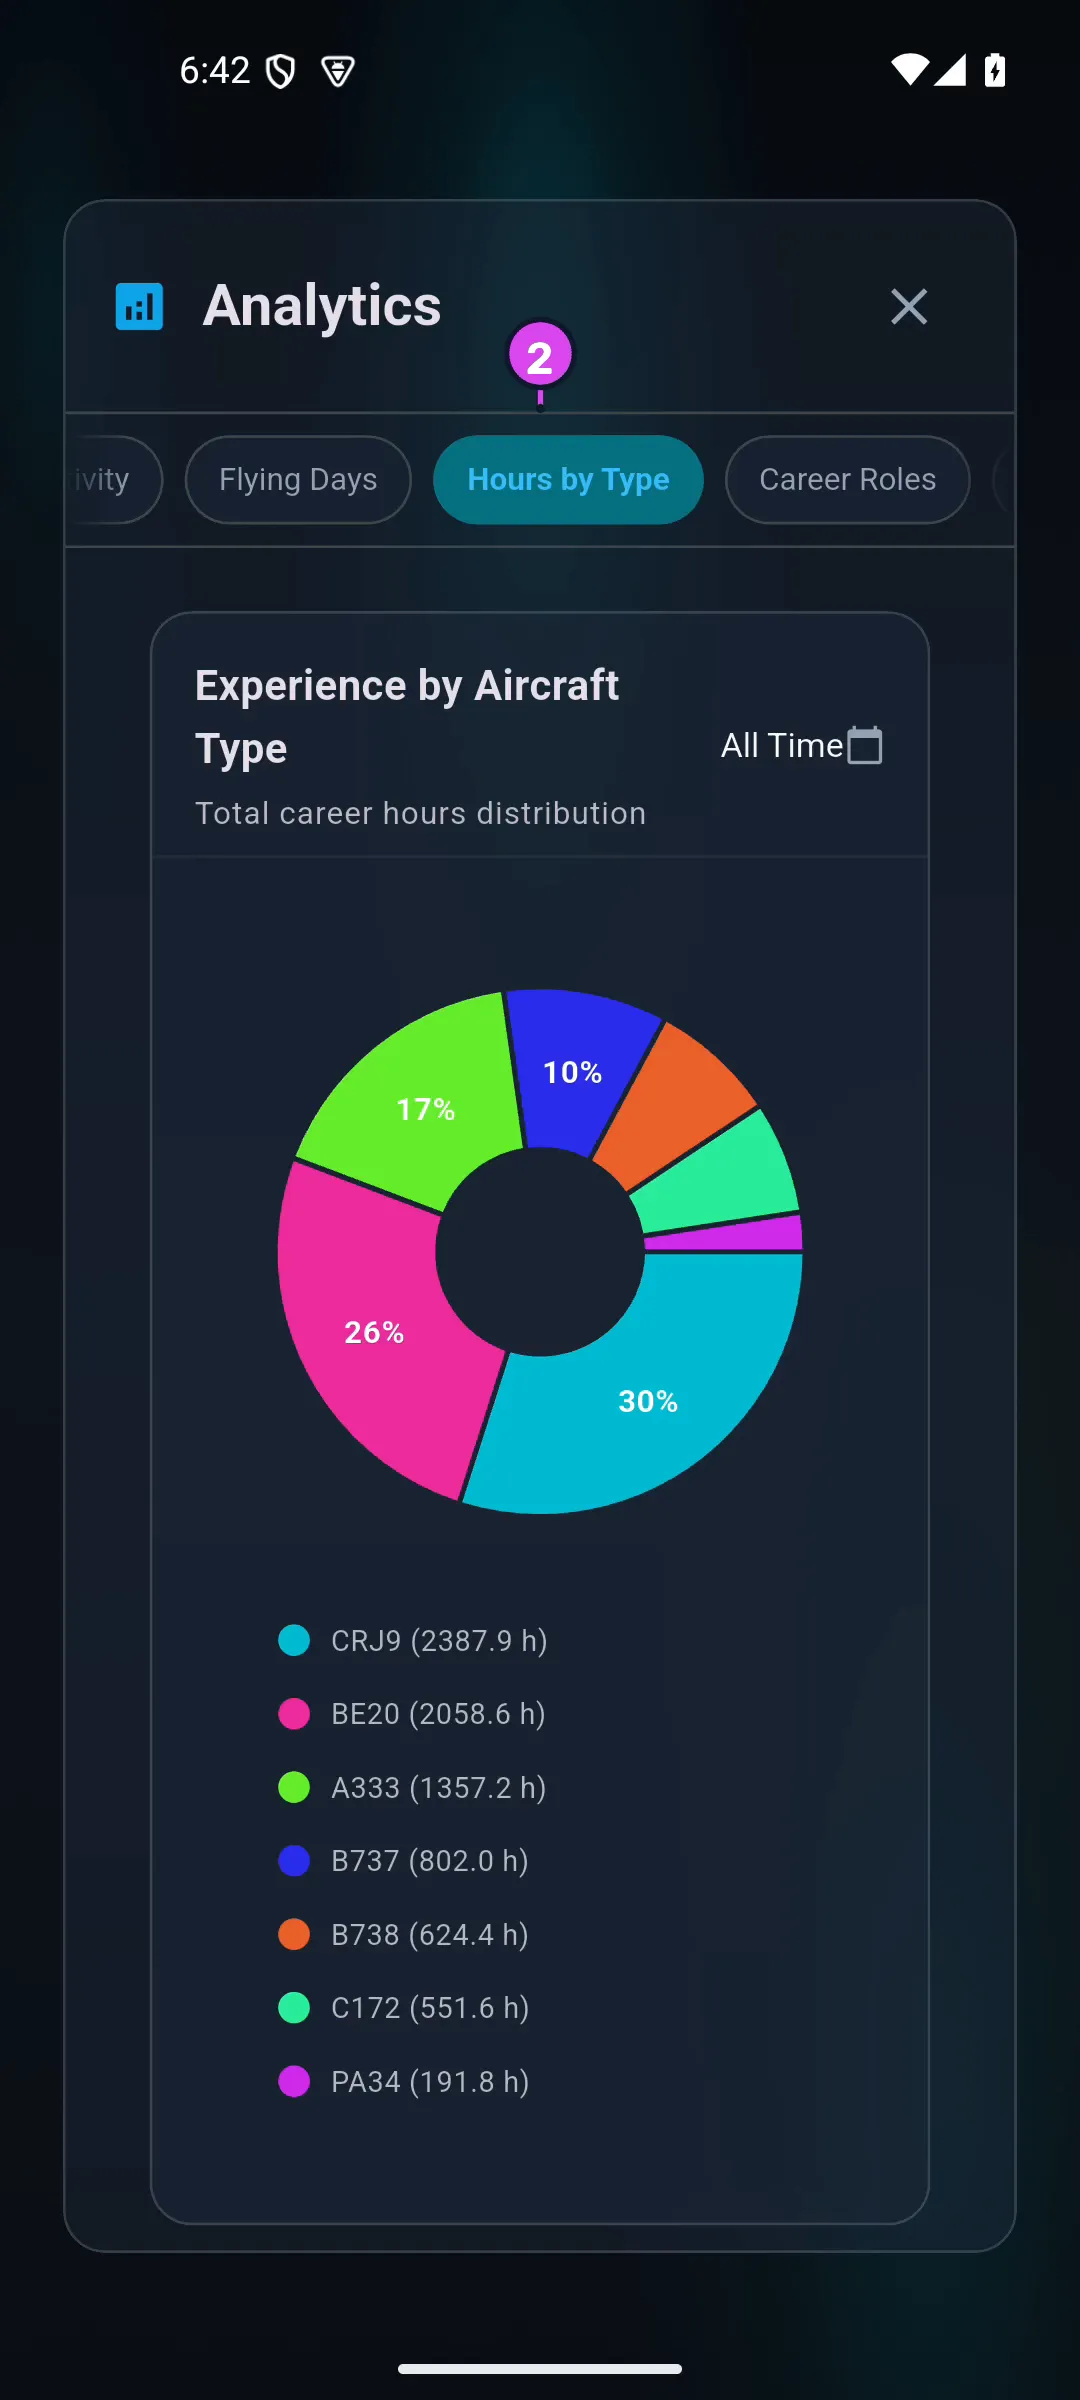
2 sidebar4 Close - Pick the chart you want. On a wide window the sixteen are listed down the
left; on a phone that list becomes a row of chips across the top that you drag
sideways.
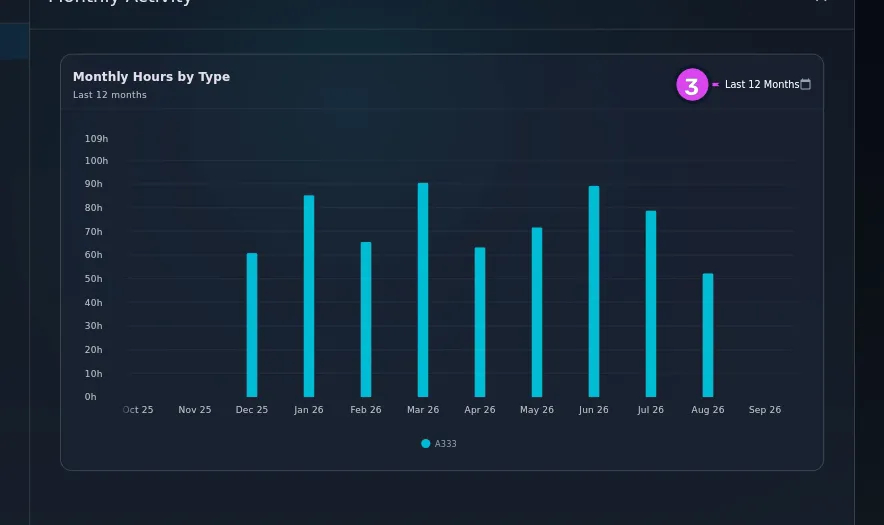
- To see one year, use the year dropdown in the chart’s top right. Only five
charts have one — Monthly Activity, Hours by Type, Approaches,
Runway Usage and Top Airports — and each dropdown is separate. It
catches everybody once: set Approaches to 2023, move to Runway Usage,
and you’re back to your whole career.
3 the dropdown — independent per chart - To leave, tap Close at the foot of the sidebar, or the ✕ in the header.
How to tell it worked
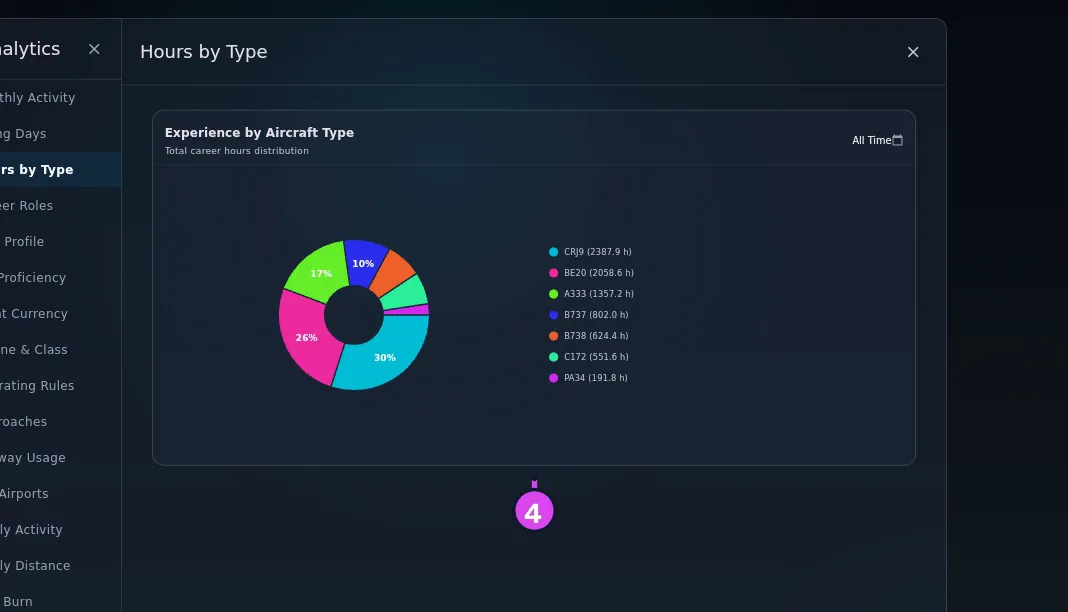
You’re on a screen headed Analytics, with one chart taking up most of it and the sixteen entries beside it or above it. The title printed on the chart is often not the label you tapped. Nothing has gone wrong — the reference table below pairs them up.
If something goes wrong
| What you see | Why | What to do |
|---|---|---|
| Every chart shows more than the logbook list does | No chart follows the filter, and the banner at the top is the app telling you so | Treat every chart as covering your whole logbook, always |
| No data available / No flights logged in this window | Nothing in that chart’s time window qualifies | Look up its window in the table below. Several are fixed, and no amount of flying widens them |
| No runway data yet. Add a runway to an approach on a flight to see it here. | Your approaches were logged without runways | Start recording the runway when you log each approach (→ C5) |
| No fuel data yet. Log fuel burned on a flight to see it here. | Not one flight has a fuel figure | Log fuel on a flight (→ C1) |
| Fuel burned is logged on N flights, but none of them record a unit… | Every flight with a fuel figure is missing its unit, so there’s nothing safe to add up | Open a flight and set its fuel unit, in Duty & Fuel (→ C1) |
| No schedule data yet. Log a scheduled out-time and an actual out-time to see punctuality. | Punctuality needs both times, and it only has one | Record a scheduled out-time as well as the actual one (→ C1) |
| No year dropdown at all | The list of years comes from Yearly Activity, and that chart has nothing in it yet | Log or import one flight that’s neither a simulator session nor carry-forward, and the dropdown appears |
| A year is missing from the dropdown | The year list ignores simulator sessions and carry-forward hours, which some charts still count | Read that chart at All Time instead |
| Error: … | The chart couldn’t load its data | Close Analytics and open it again |
Reference: the sixteen charts
These numbers won’t match the stats bar: each chart counts its own set of flights. The first column is the label you tap, and the second is the title printed on the chart it opens. Where they differ, it isn’t a mistake on your part.
| Label | Card title | What it counts | Window | Year dropdown |
|---|---|---|---|---|
| Monthly Activity | Monthly Hours by Type | Hours per month, split by aircraft type | Last 12 months | yes |
| Flying Days | Flying Days | The days you flew, drawn as a calendar heatmap | Trailing 365 days | no |
| Hours by Type | Experience by Aircraft Type | Career hours per aircraft type | All time | yes |
| Career Roles | Career Experience by Role | Hours per role — PIC, SIC, P1US, Relief, FE, Dual Rec., Dual Given. PIC includes your Student PIC time | All time | no |
| Role Profile | Role Profile | Those same seven roles, drawn as a shape. It needs at least three roles with hours in them before it will draw | All time | no |
| IFR Proficiency | Instrument Proficiency | Actual against simulated instrument time | Last 12 months | no |
| Night Currency | Night Currency | Night hours and night landings in the last 90 days, with your career totals under them | 90 days | no |
| Engine & Class | Engine & Class Mix | Hours by engine type, and by aircraft class | All time | no |
| Operating Rules | Operating Rules | Hours by the Operating Under value on each flight, subtitled Total career hours by Operating Under. Flights without one go in Other/Unset | All time | no |
| Approaches | Approach Types | Approaches flown, by type. Approaches flown in a simulator are counted here | All time, or one year | yes |
| Runway Usage | Runway Usage | Approaches per runway ident, pooled across every airport — every “27L” you’ve ever flown counts together, simulator approaches included. Top ten only | All time | yes |
| Top Airports | Top Airports | Your most frequent arrival airports, top ten only. Departures aren’t counted, and a simulator session isn’t a visit | All time | yes |
| Yearly Activity | Yearly Activity | Flight hours per year | All time | no |
| Yearly Distance | Yearly Distance | Distance flown in each year, one bar per year, in your distance unit. Its subtitle says Cumulative distance flown … per year, but no bar includes the years before it | All time | no |
| Fuel Burn | Fuel Burn | Fuel burned per year, in one unit only — whichever unit you’ve burned the most of. Flights logged in any other unit are left out of the chart entirely | All time | no |
| Punctuality | Departure Punctuality | Actual against scheduled out-time, grouped as Early, On time, 15–60 late, 60+ late | All time | no |
Gotchas
The banner counts your filters. When a filter is on, a strip across the top reads Your logbook filter is not applied here — these charts cover your whole logbook (or Your N logbook filters… for more than one). It counts everything you’ve narrowed by, including a saved search. If you’ve filtered to one tail and want that tail’s numbers, read them from the stats bar (→ D2), not from here.
Nothing here is a currency or recency check. You can look at ninety days of night landings on this screen without learning whether you’re legal. For that, use the currency card in Area G.
Simulator sessions are left out of every chart except two. Approaches and Runway Usage count training-device sessions alongside real flights. Every other chart, Fuel Burn and Punctuality included, leaves them out. If your approach total looks high against your flight hours, this is nearly always why.
Fuel Burn tells you when it can’t safely add up what you logged. If every flight with a fuel figure is missing its unit, you don’t get the usual empty state — the chart reads Fuel burned is logged on N flights, but none of them record a unit — so there is nothing that can be safely added up. Once it is drawing, a note under it counts anything still left out: flights logged in a different unit, flights logged with no unit at all, or both. They’re counted separately because only the no-unit ones are yours to fix.
A slice labelled PREVEXP is carry-forward. Hours you entered as Previous Experience (→ B7) are left out of the charts that plot over time, and counted in five of the others — Hours by Type, Career Roles, Role Profile, Engine & Class and Operating Rules. Each category’s hours are filed under a stand-in aircraft of their own rather than one lump, so they won’t all collect in a single “unknown” wedge:
- Hours by Type gives each category its own slice, named for it — PREVEXP-SEL, PREVEXP-MEL, PREVEXP-HELICOPTER, PREVEXP-UNKNOWN.
- Engine & Class has no engine type for them, so they sit in a slice with a blank legend label. On the class side they do have a real class — SEL, MEL, HELICOPTER and so on — which can share a slice with an aircraft type you created yourself with the same class.
- Operating Rules has no rule for them, so they go in Other/Unset.
- Career Roles and Role Profile spread them across the real roles, from the PIC, night and dual hours you entered.
Read a PREVEXP slice as “the logbook before this one”, not as data you forgot to enter. The one exception: carry-forward hours you entered against a training device are filed under a simulator, so like every simulator session they’re left out of all five.
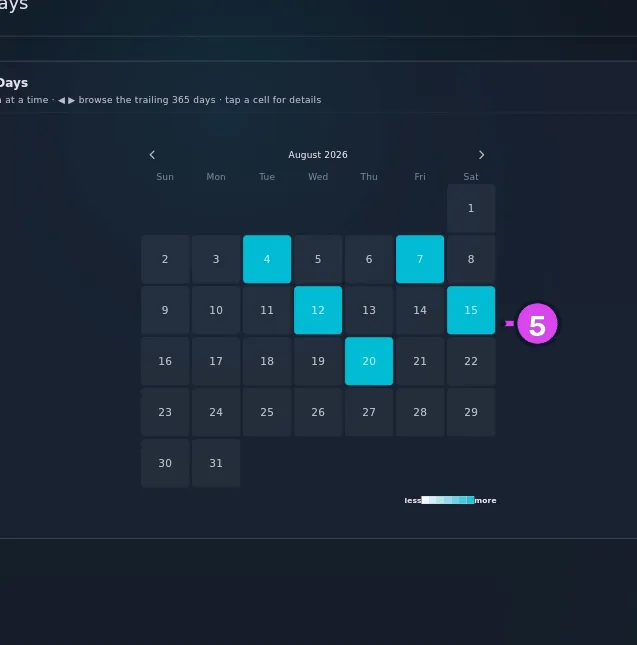
Flying Days shows one month at a time. Its subtitle says Trailing 365 days · tap a cell for details, but the calendar under it shows a single month. Use the arrows either side of the month name to move through the year. The data is right; the label promises more than one screen shows.
The Night Currency bars are always full. Both bars fill completely at three night hours or three night landings and stay full above that, so past three they tell you nothing. Read the figures printed on them instead, and use the currency card in Area G for the rule you’re actually checking against.
Hours by Type lists eight types and draws all of them. The legend stops at the eight largest, with no “and N more”, while the chart still draws every type you’ve ever flown. A slice with no legend entry isn’t a bug — it’s a real type, further down the list.